The inventory reports in MYOB Business give you the insights to help you manage your inventory. They save you time from having to manually check stock levels, help ensure that you always have enough stock for your customers and that you're stocking the right type of items.
Easily see how many items you have on hand, how many are on order or committed to a sale, how profitable each one is and when you need to reorder them.
You can view inventory reports from the Inventory report group (go to the Reports page > Inventory).
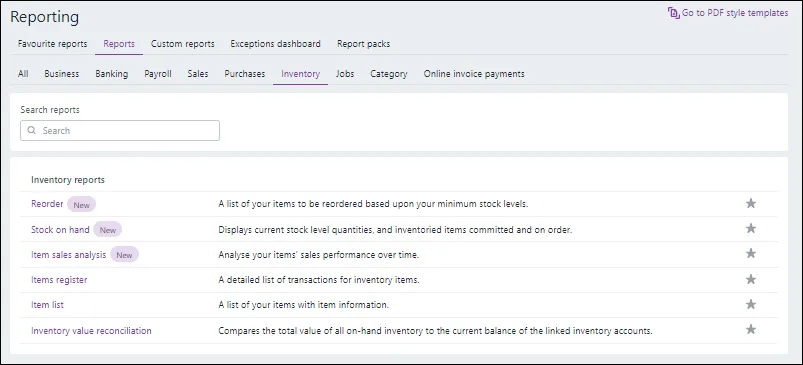
Report descriptions
Name | Description |
|---|---|
Reorder | See a list of your inventory items, their primary supplier, the number of units on hand or committed to sales or orders and easily reorder them. |
Stock on hand | Get a snapshot of your inventory quantities, including the units on hand and committed to sales, or orders. View the total value and average cost of your items. |
Item sales analysis | Analyse the sales performance and profitability of your items for a specified period. View the quantity of items sold, their gross profit and profit margin, and the cost of sales you incurred selling them. |
Items register | See all of the inventory items you've used in transactions within a specified date range. View the details of these transactions. |
Items list | Easily get a complete list of all of your items, their suppliers and values. |
Inventory value reconciliation exceptions | Reconcile your inventory by comparing the total value of all on-hand inventory to the current balance of the linked inventory categories. |
To run an inventory report
Go to the Reporting menu and choose Reports.
Click the Inventory tab.
Click the name of a report to run it.
Choose your report filters – these vary depending on the report. For example, choose what suppliers or items you want to report on. As you change report filters, the report will update automatically.
Select your Report options, for example if you want to include cents in amounts or if you want to show the minus sign for negative amounts.
If you want to customise the report further, for example to select and reorder columns, click Customise. For general information about customising reports, see Customising reports.
If the report is long, export it as an Excel file (click the Export button > Excel). Then you can use Excel's tools to sort it.
Click a report name below to find out what it can tell you.
Reorder report
How report amounts are calculated
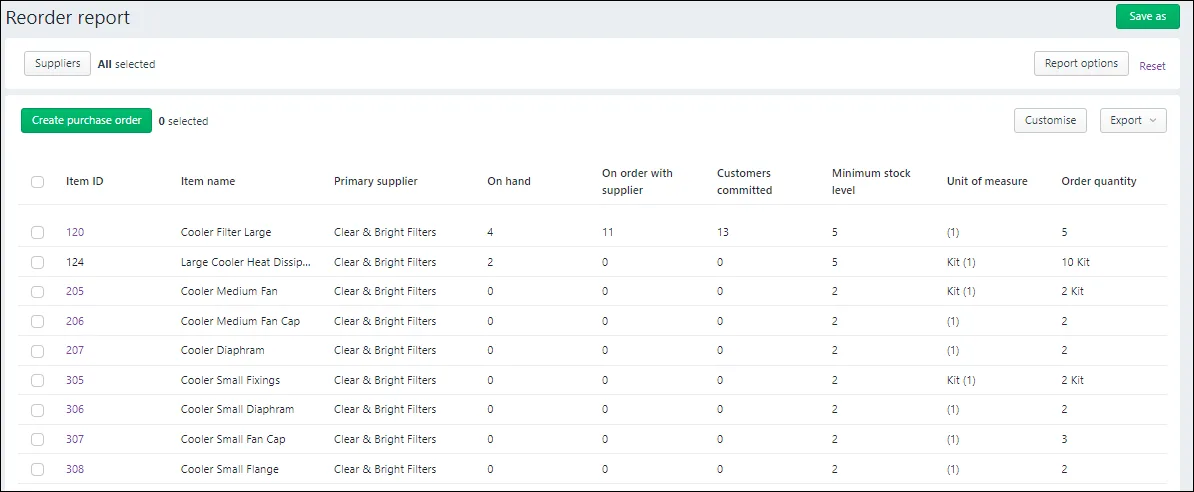
On hand = the number of the item (by unit of measure, eg. box) in stock (excluding items committed to sales or on order with suppliers)
On order with supplier = the number of items (by unit of measure) on order from a supplier
Customers committed = the number of items you've sold (included in an open invoice to a customer)
Minimum stock level = the minimum number of items, by unit of measure, you want to keep in stock, as set in the Minimum stock level field in the item's restocking information
Unit of measure = what comprises a buying unit of the item, for example, each, box, case, kit, etc
Order quantity = the default reorder quantity (per buying unit of the item), as set in the Default reorder quantity field in the item's restocking information
What the report can tell you
This report indicates all the item's you might want to reorder. This is where the available quantity of an item (the on-hand quantity plus the quantity on order with suppliers, less the quantity recorded in sales) falls below the minimum stock level, as set in the item's restocking information.
It also gives you a picture of your stock movement: how many items are on order and how many are committed to customer sales.
A great feature of the report is that you can instantly create a purchase order for items you want to reorder, without having to go to other menus or pages. See Reordering items for more information.
Stock on hand report
How report amounts are calculated
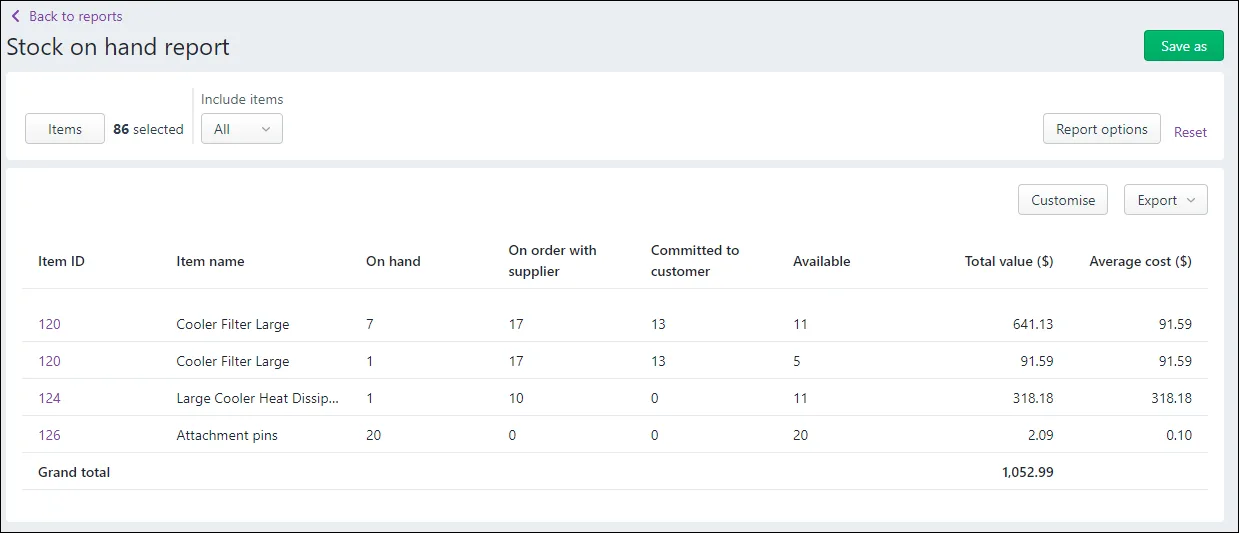
On hand = the on-hand quantity of each item
On order with supplier = the number of items (per buying unit) on order from a supplier
Committed to customer = the number of selling units of the item in unpaid (open) invoices
Available = the number of items (per selling unit) available for sale (less committed to customers)
Total value = the total cost value of the items on hand
Average cost = Total value / Units on hand
Grand total = the total value of all of your inventory
What the report can tell you
The report shows your inventory quantities, minus the number of units committed to sales, or orders. This can help you with your inventory planning and to determine if there is sufficient stock for sales. You can also easily see the total value of your inventory.
Item sales analysis report
How report amounts are calculated
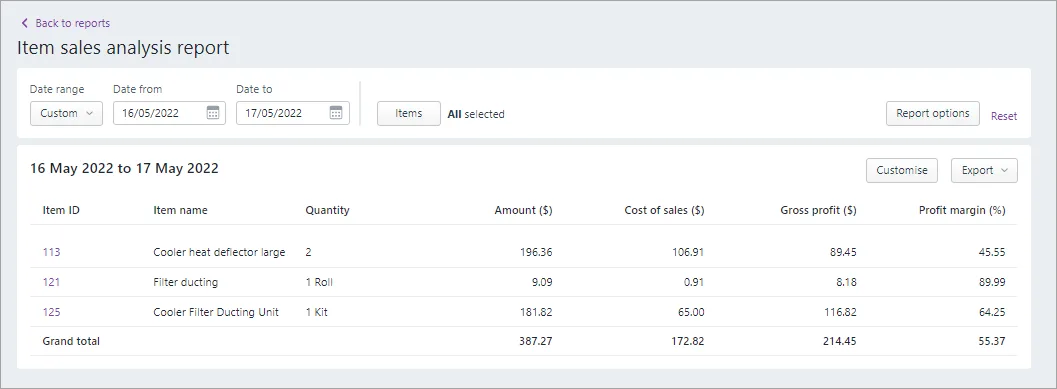
Quantity = the number of the selling unit sold in the specified period, for example six boxes
Amount = the total dollar value of sales of the item for the specified period
Cost of sales = cost of purchasing or manufacturing the items you've sold
Gross profit = Amount - Cost of sales
Profit margin = Gross profit / Amount * 100
What the report can tell you
If there are items with significantly smaller profit margins than then rest of your inventory, it could indicate underperforming product lines, excessive costs of sales for particular items (which might require you to find another supplier) or that you need to adjust your pricing. Run the report over different periods and compare the profit margins of items over time.
Items register report
How report amounts are calculated
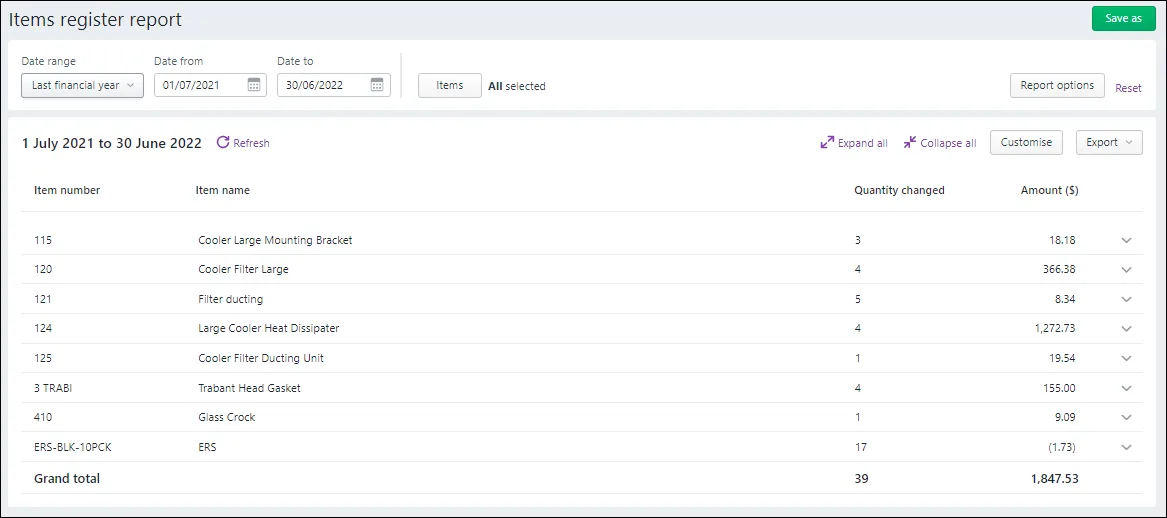
Starting quantity = the number of units of the item on hand before the transaction was recorded
Quantity changed = the number of units of the item added to or removed from inventory by the transaction
Amount = the total cost of the items bought, sold or adjusted
On hand = the units on hand after each transaction
Current value = the total value of units on hand after each transaction
To see all of the columns in the report, click Expand all.
What the report can tell you
You can see all the sales, purchases and inventory adjustments which affect the on hand quantities and current value of your inventoried items.
Item list report
How report amounts are calculated
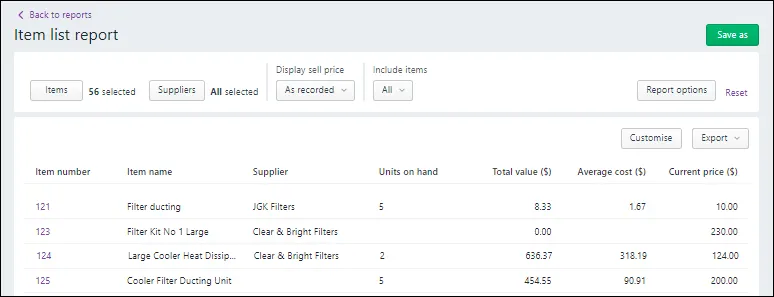
Units on hand = the on-hand quantity of each item
Total value = the total cost value of the items on hand (Average cost * Units on hand)
Average cost = Total value / Units on hand
Current price = the current selling price of the item
What the report can tell you
This report gives you a basic list of your items, including the primary supplier, units on hand and current values. If you want to see the units on order or committed to sales, run the Stock on hand report instead.
Inventory value reconciliation exceptions report
How report amounts are calculated
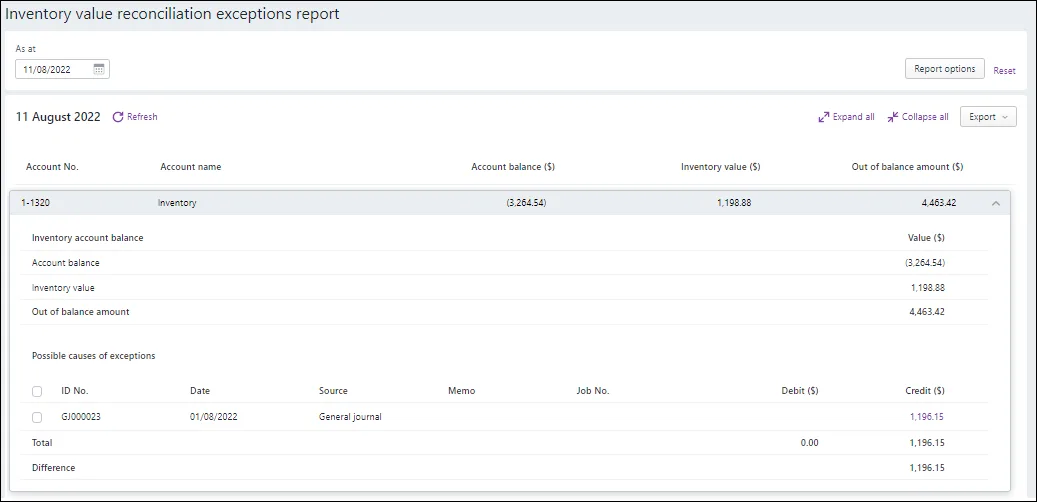
Category balance = the balance of your inventory asset category
Inventory value = the total current value of your inventory items
Out of balance amount = Category balance - Inventory value
What the report can tell you
This report reconciles the balances of your inventory asset category with the values of the associated inventoried items as at a particular date. If the report has an out-of-balance amount, it will suggest transactions that may have caused it. Click Expand all to see them and click a transaction's credit or debit to open it.
If your inventory is out of balance
If the Inventory value reconciliation exceptions report is out of balance, check the following:
What to look for | Possible cause | Solution |
|---|---|---|
Wrong feature used | Recording an inventory adjustment using a journal entry instead of the inventory adjustment feature. | Delete the transaction and record it again using the correct feature. |
Transactions allocated directly to the inventory asset category | Using the inventory asset category as the allocation category in a sale, purchase, spend money, receive money or inventory adjustment transaction. | Delete the transaction and record it again using the correct allocation category. |
Incorrect linked categories | The linked asset category for an inventory item has been incorrectly linked to a category other than your inventory asset category. | Check the linked asset category for your items (Products and services > open the item > Inventory section > Asset category for tracking inventory). If this category has been changed: 1. Change it back to the correct linked category. 2. Determine the value of purchases which have been recorded while the wrong linked category was set (this is likely to be your out of balance amount) 3. Record a journal entry to transfer this value from the wrong linked category to the correct linked category. |
Exporting, saving and printing
You can export your report as an Excel spreadsheet or PDF by clicking Export. Note that you must enable editing of the spreadsheet from within Excel. If editing is disabled, the spreadsheet will not display the totals calculated in the report.
When exporting PDFs, you can also choose which style template you want to use. When the PDF displays, you can save it.
When viewing a report, click View and print to display the report as a PDF in a new browser tab, where you can save or print it.
Bundle your inventory reports together
Add multiple reports to a single document, complete with a cover page, table of contents and personalised styling. You can then run the report pack with your latest inventory or other business data and share it with others. For more information, see Report packs.